Knowledge Hub
How to Read OBD2 Live Data: PIDs, Fuel Trims, O2 Sensors and More

An OBD2 trouble code tells you that the vehicle detected a problem or condition.
Live data lets you watch supported diagnostic values while the vehicle is operating.
That can make live data one of the most useful features on an OBD2 scanner, and one of the easiest to misuse.
A screen full of numbers is not a diagnosis.
The useful question is not: “Is this number normal?” It is: “Is this value reasonable for this vehicle, sensor and operating condition, and does it agree with the other evidence?”
That distinction matters. Fuel trim at warm idle can tell a different story from fuel trim under load. A conventional oxygen sensor behaves differently from a wideband air/fuel sensor. MAF readings depend on engine size and airflow. MAP changes with load and atmospheric pressure.
So instead of memorizing one universal table, learn how to read patterns.
What Is OBD2 Live Data?
Live data is diagnostic information that a compatible scan tool requests from the vehicle while the relevant control system is operating.
Depending on the vehicle and scanner, you may be able to view parameters such as engine RPM, vehicle speed, engine coolant temperature, calculated engine load, throttle position, short-term fuel trim, long-term fuel trim, oxygen-sensor or air/fuel-sensor information, mass air flow, manifold absolute pressure, intake-air temperature, and fuel-system status.
Standardized OBD provides a regulated diagnostic foundation, but not every vehicle supports every possible PID, and an enhanced scanner may display manufacturer-specific data beyond the generic OBD set.
That is why two scanners can show different amounts of information on the same vehicle.
What Is a PID?
PID commonly means Parameter ID.
In practical scanner use, it is a diagnostic data item that identifies a value or status the scan tool can request and display. Examples include engine speed, coolant temperature or fuel trim.
The important point is that a PID label is only the beginning. To interpret it correctly, you also need to know the unit, the sensor or calculated value it represents, the current operating condition, whether the engine is warm or cold, whether the fuel system is in open or closed loop, whether the value should be compared with another bank or PID, and whether the vehicle uses a conventional or different sensor strategy.
Live Data vs Freeze Frame
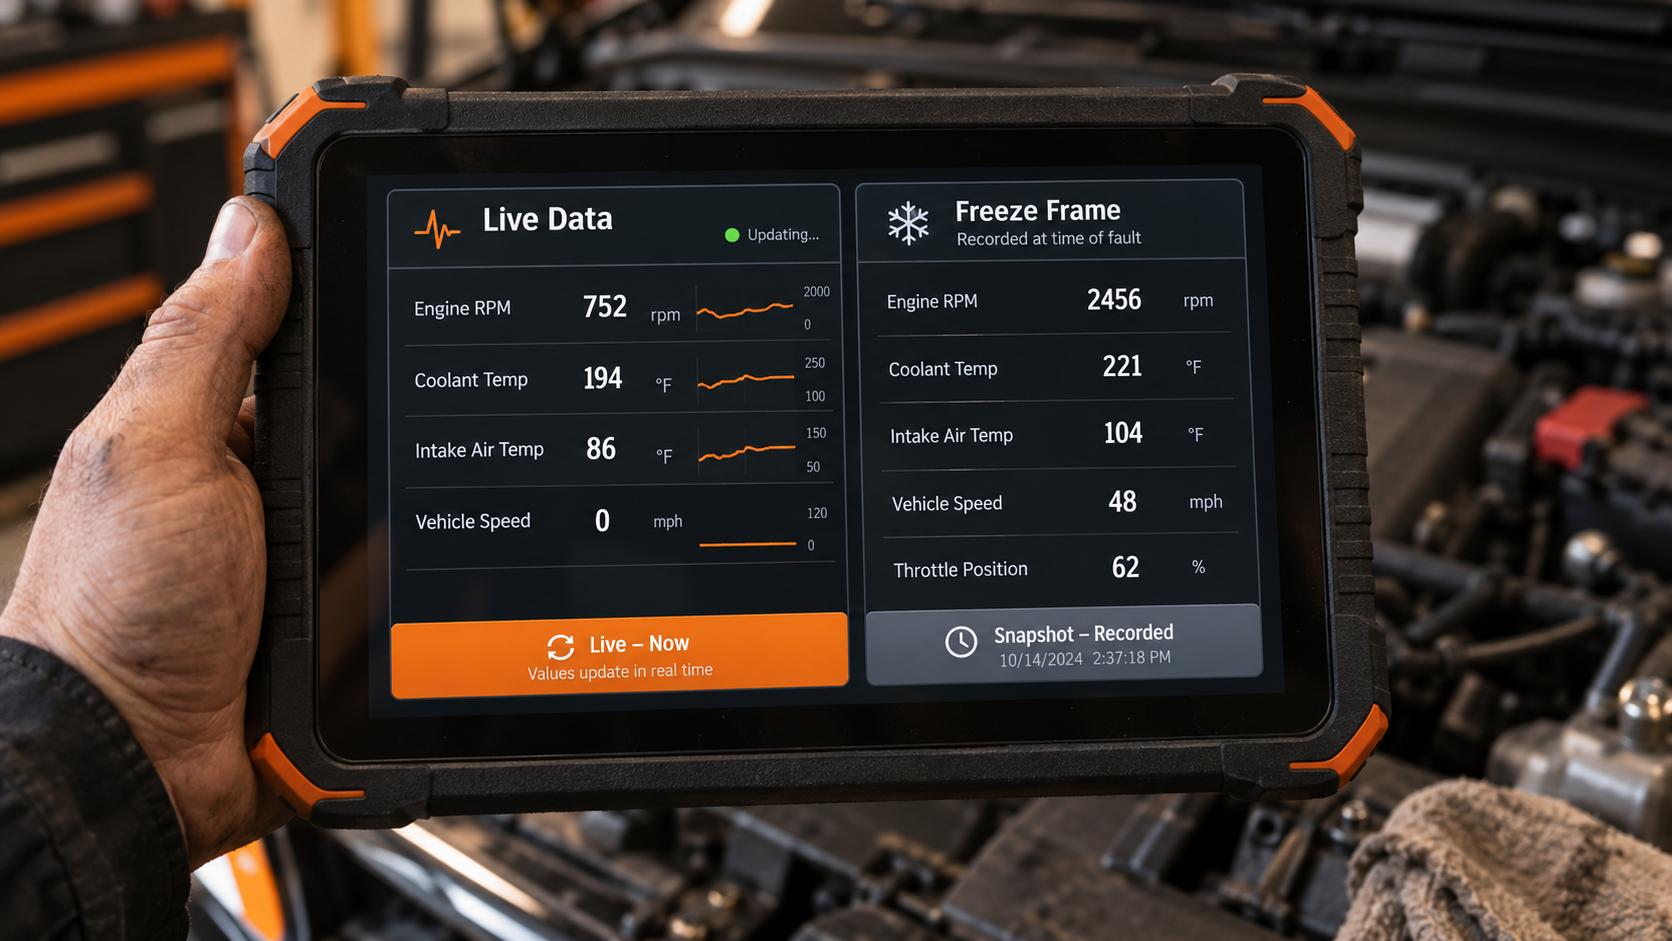
Live data and freeze-frame data are related but not the same.
Live data shows supported values as the vehicle operates now. Freeze frame preserves a snapshot of certain operating conditions associated with a stored emissions-related fault.
Think of it this way: freeze frame is what was happening around the time the fault was recorded, while live data is what the vehicle is reporting while you are looking at it now.
Used together, they can be much more useful than either one alone.
If you need the complete scanning workflow, start with How to Use an OBD2 Scanner: Step-by-Step Guide.
The Most Important Rule: Context Before Numbers
A common mistake is searching the internet for a “normal OBD2 live data chart” and treating every value outside a generic range as proof of a failed component.
Vehicle diagnosis is not that simple. A value can change because of engine temperature, engine speed, engine load, altitude/barometric pressure, throttle position, fuel strategy, sensor design, engine displacement, forced induction, vehicle calibration, or an actual fault.
That means the same number can be reasonable in one condition and suspicious in another.
Before interpreting a PID, record the operating condition. At minimum, ask: Is the engine cold or fully warmed? Is it idling, cruising or under load? Is the fuel system in open or closed loop? What are RPM and calculated load? Are you looking at Bank 1, Bank 2 or both? What other related PIDs are doing at the same time?
Never diagnose from a number without its condition.
Which PIDs Should You Watch First?
Do not select every PID your scanner can display.
Too many selected parameters can make the screen difficult to interpret and, depending on the tool/protocol, can affect how quickly the displayed data refreshes.
Start with a small group relevant to the problem. For many engine-performance questions, a useful starting set can include RPM, engine coolant temperature, fuel-system status, STFT, LTFT, MAF and/or MAP where applicable, relevant O2 or A/F sensor data, calculated load, and throttle position.
Then add or remove PIDs according to the diagnostic question.
The goal is not to collect the most data. The goal is to collect the right related data.
Fuel System Status: Open Loop vs Closed Loop
Before interpreting fuel trims and oxygen-sensor feedback, check fuel-system status.
In closed-loop operation, the engine-management system is using feedback to help control the air/fuel mixture. In open-loop operation, that feedback strategy is not being used in the same way.
A cold engine may initially operate open loop, and other conditions can also affect loop status.
This matters because you should not interpret feedback-related PIDs without understanding whether the control system is actually in the expected operating state.
If the engine is fully warm but the system is not behaving as expected, that itself can become a diagnostic clue, but it is not enough by itself to identify a failed part.
Short-Term Fuel Trim (STFT) Explained
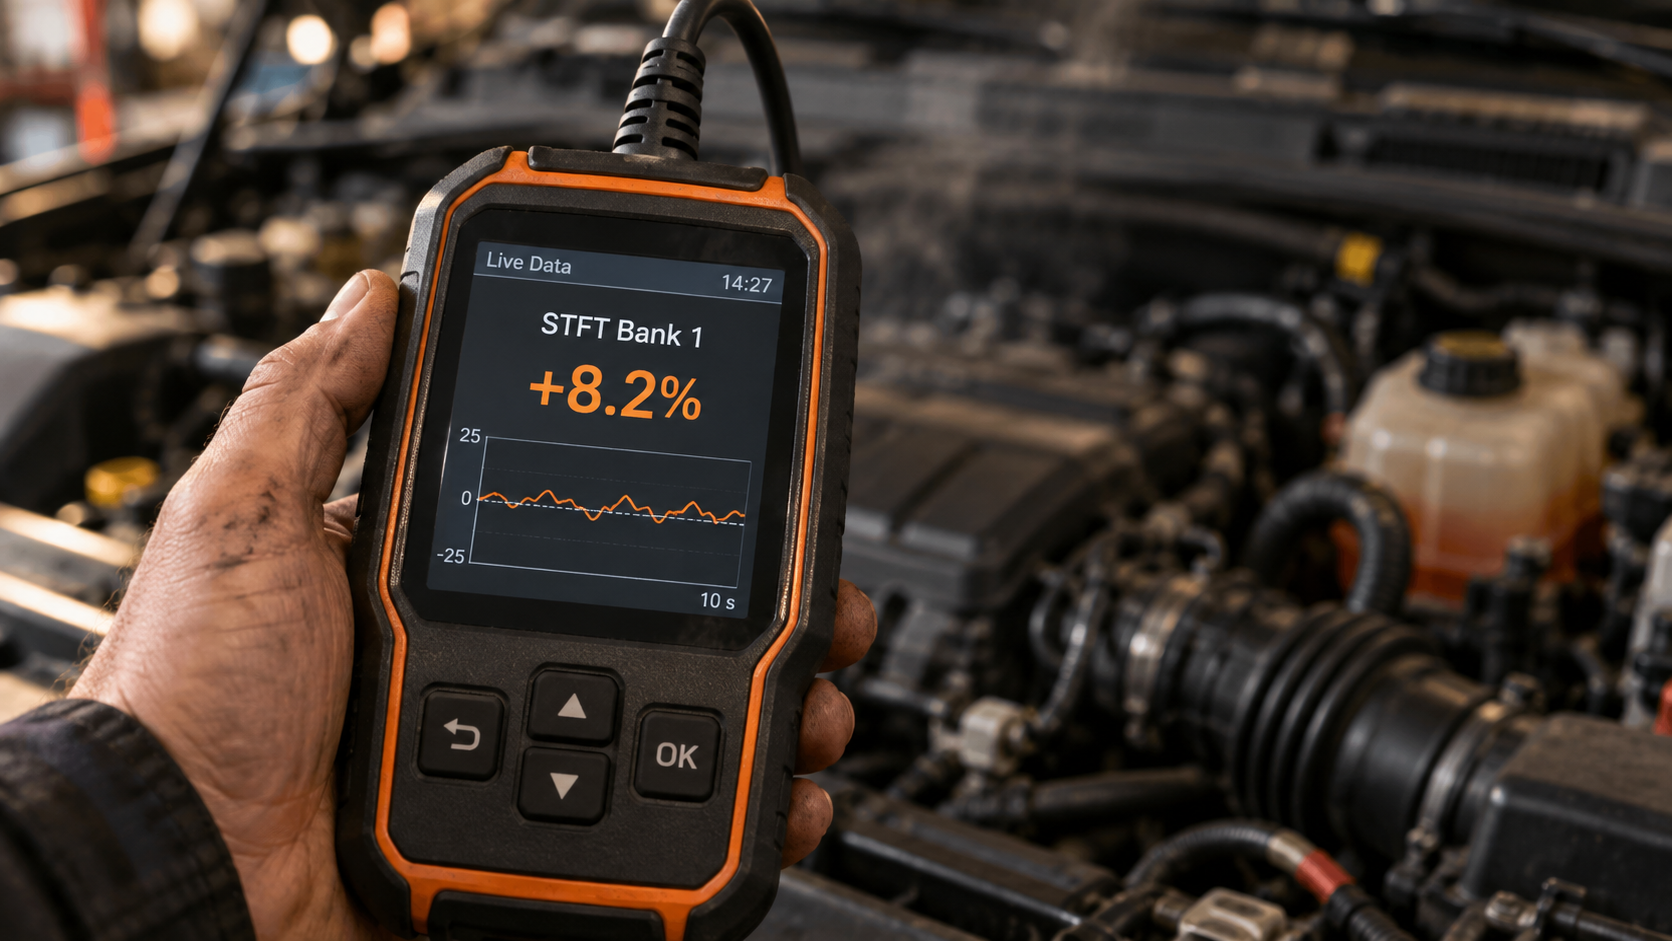
Short-term fuel trim represents relatively fast fuel correction by the engine-control strategy. It is commonly displayed as a percentage.
The easiest practical interpretation is: positive STFT means the control system is adding fuel relative to its base calculation; negative STFT means the control system is reducing fuel relative to its base calculation; near zero means relatively little short-term correction is being commanded at that moment.
But do not turn that into “positive = vacuum leak” or “negative = bad injector.” Those are possible diagnostic directions, not automatic conclusions.
Positive correction can occur for multiple reasons, including conditions involving unmetered air, fuel delivery, airflow measurement, exhaust leaks or other inputs. Negative correction can also have multiple causes.
Fuel trim tells you how the control system is correcting. It does not tell you, by itself, why the correction is necessary.
Long-Term Fuel Trim (LTFT) Explained
Long-term fuel trim represents learned fuel correction over a longer period or operating history than STFT. It is also commonly displayed as a percentage.
Again: positive LTFT means learned correction is adding fuel; negative LTFT means learned correction is reducing fuel.
Long-term trim is useful because it can reveal a persistent correction that might be less obvious from a rapidly moving STFT value.
But LTFT is not a universal “health score.” Vehicle strategies differ, and learned corrections can be organized differently across operating regions and calibrations. That is one reason SCG does not publish one fixed LTFT cutoff and call everything beyond it a fault.
How to Read STFT and LTFT Together
STFT and LTFT are more useful together than in isolation.
A simple conceptual approach is: LTFT is learned background correction, while STFT is what the control system is correcting more immediately.
Suppose LTFT is positive and STFT is also being driven positive under the same condition. That suggests the system is both carrying learned positive correction and still asking for additional short-term correction. That is more meaningful than seeing one positive STFT sample for a fraction of a second.
Likewise, a learned correction can remain while short-term trim moves around it. The pattern over time and under controlled operating conditions matters more than one screenshot.
Manufacturer OBD documentation reinforces this principle: fuel-system diagnostics can evaluate filtered long-term and short-term trim together and only under defined enable conditions.
How Operating Conditions Change the Meaning of Fuel Trim
One of the most useful beginner diagnostic comparisons is to observe fuel trim under more than one operating condition: for example, warm idle, a steady higher engine speed with no load when appropriate, and cruise or load data captured safely where appropriate.
Why? Because some faults affect the engine differently as airflow changes. A relatively fixed amount of unmetered air can represent a larger percentage of total airflow at idle than at higher airflow.
So a pattern that is strongly positive at idle but becomes much less positive as airflow rises can point the diagnostic process in a different direction from a pattern that remains strongly positive across a broad range of loads.
But this is a diagnostic clue, not proof of one component. Fuel pressure, exhaust leaks, sensor accuracy, purge flow, engine mechanical condition and other factors may also need to be considered.
O2 Sensor Live Data: First Identify the Sensor Type
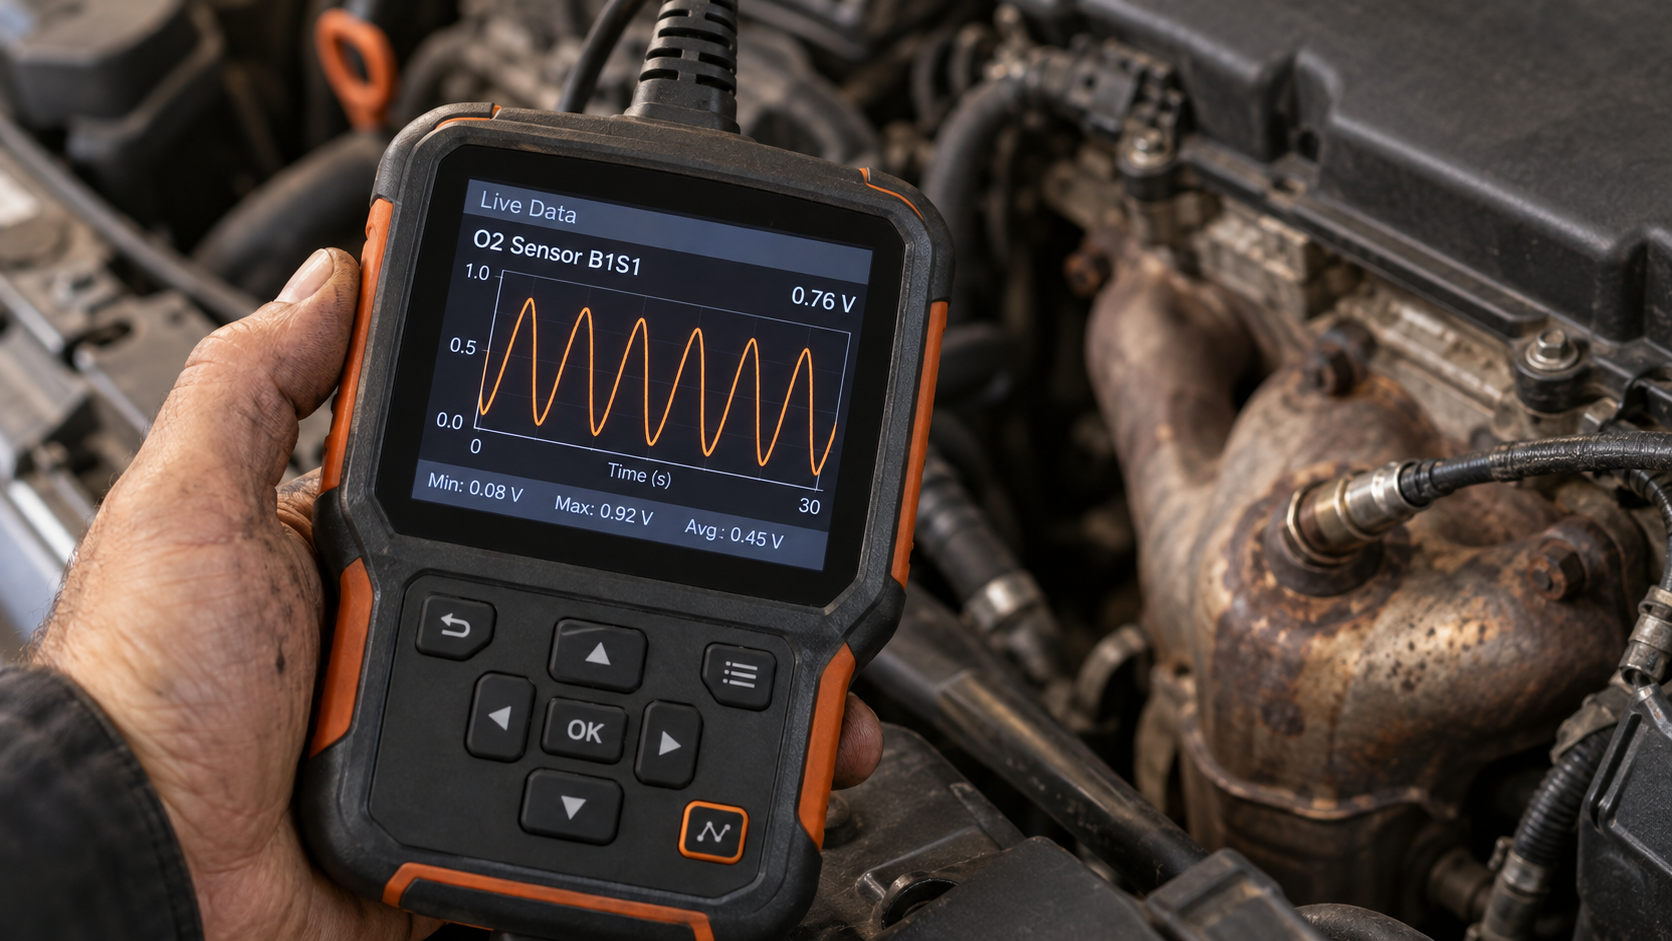
This is where many generic live-data guides become too simplistic.
Not every oxygen-related sensor should be interpreted using the same voltage rule. Modern vehicles can use different sensor technologies. Before interpreting the graph, identify what you are looking at.
Conventional narrowband O2 sensors
A conventional zirconia narrowband oxygen sensor is primarily useful around the stoichiometric switching point. When the engine is warm and operating in appropriate closed-loop conditions, an upstream narrowband sensor can switch between lean-indicating and rich-indicating states as the control system adjusts mixture.
Many tutorials describe this as voltage moving roughly through the familiar low-to-high narrowband range. That description can be useful only when you have confirmed that the PID represents a conventional narrowband voltage signal. Do not apply it blindly to every modern A/F sensor.
Wideband / air-fuel ratio sensors
Wideband, linear or air/fuel ratio sensors operate differently. They have a broader response range and can provide a signal proportional to residual oxygen content.
The scanner may therefore display lambda/equivalence ratio, current, a converted voltage, manufacturer-specific values, or another representation.
So if a modern upstream sensor does not “switch 0.1 to 0.9 V” like an old-school narrowband example, that does not automatically mean the sensor is bad. First identify the sensor type and the PID definition.
Upstream vs downstream sensors
Sensor position also matters. An upstream sensor is located before the catalytic converter and is commonly important to mixture feedback. A downstream sensor is located after the catalyst and is commonly used as part of catalyst monitoring.
Do not expect upstream and downstream sensors to have identical roles or identical patterns. And do not diagnose a catalytic converter from a simplistic rule such as “the two graphs look similar, therefore the catalyst is bad.” Catalyst diagnostics depend on the vehicle’s monitoring strategy and operating conditions. DTCs, monitor results, service information and additional testing may be required.
MAF Live Data
The Mass Air Flow sensor reports the amount of air entering the engine on vehicles that use a MAF-based strategy. A scanner commonly displays MAF in units such as grams per second.
The value should generally change logically as engine airflow changes. If engine speed/load increases, airflow should respond accordingly.
But there is no single universal idle MAF number that is correct for every engine. MAF depends on factors including engine displacement, RPM, load, volumetric efficiency, forced induction, altitude, temperature and engine design.
Use vehicle-specific specifications when available. For diagnosis, ask whether the reading is plausible and responsive, and compare it with other evidence such as fuel trim, load, MAP and operating condition.
MAP Live Data
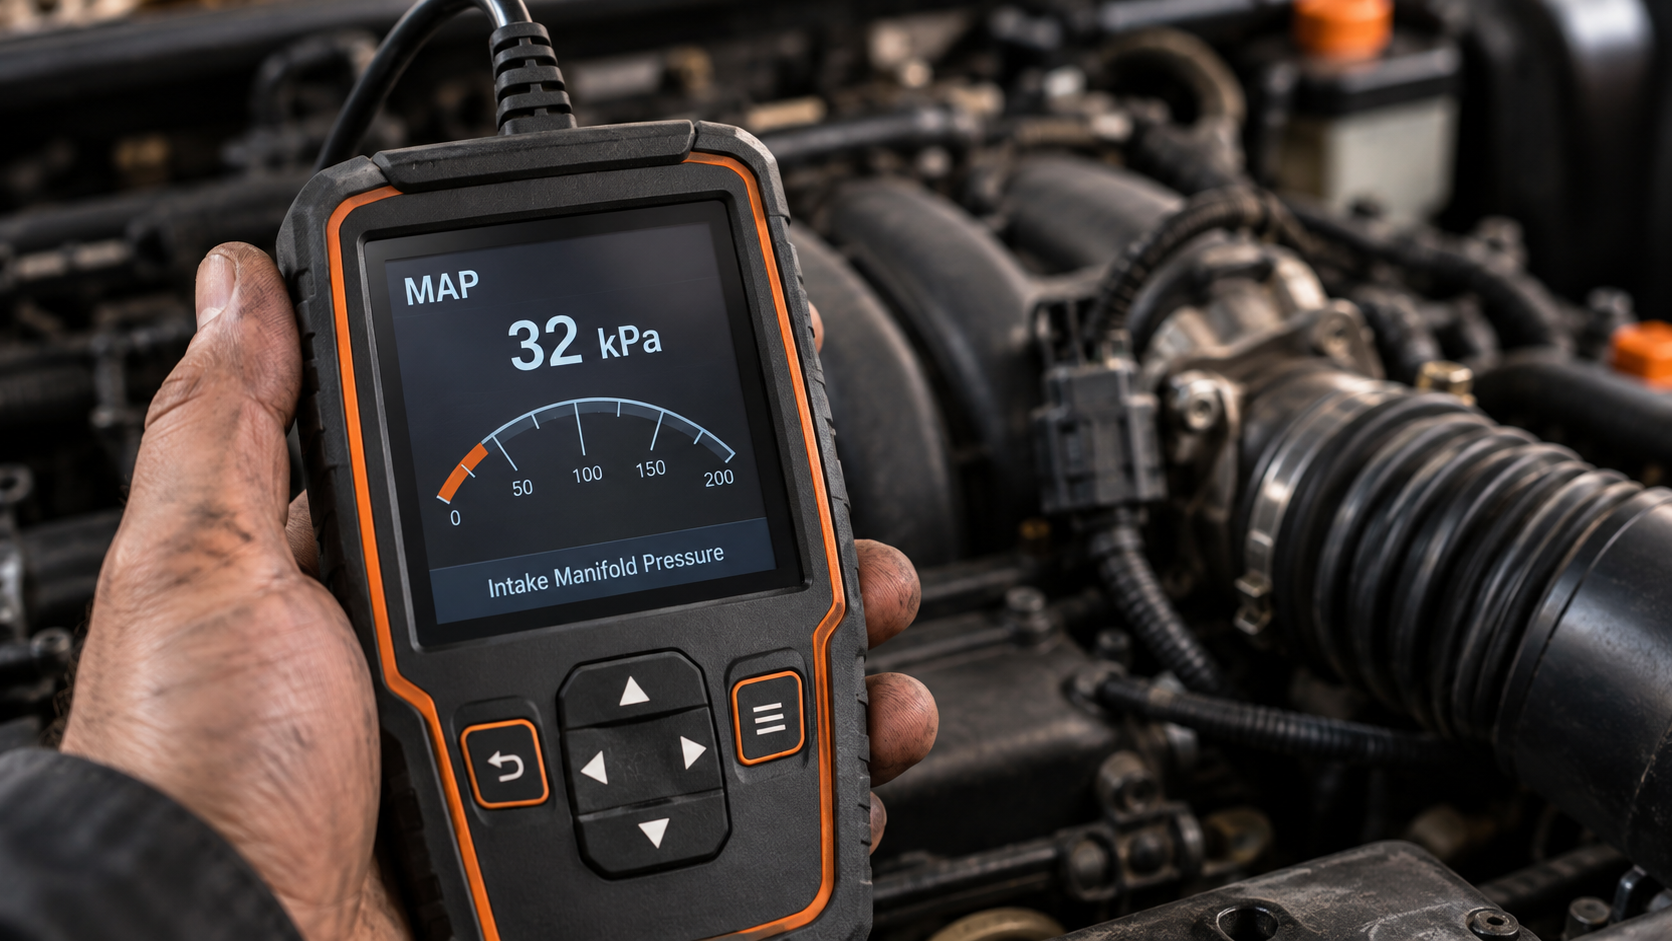
MAP means Manifold Absolute Pressure. It reports absolute pressure in the intake manifold on vehicles that provide the PID.
The interpretation depends heavily on engine type and load. On a naturally aspirated gasoline engine, manifold pressure at closed-throttle idle is typically substantially below atmospheric pressure, then moves toward atmospheric pressure as load/throttle increases. On turbocharged or supercharged engines, pressure behavior can be very different under boost. Altitude also changes the atmospheric baseline.
So a raw MAP number without barometric pressure, load and engine context can be misleading. Again: context before numbers.
Engine Coolant Temperature
Engine Coolant Temperature (ECT) is one of the simplest-looking PIDs and one of the most useful sanity checks.
Watch it from a cold start when appropriate. Before the engine has run, coolant temperature should be plausible relative to the vehicle’s actual thermal condition and ambient environment. As the engine warms, the value should generally rise in a physically plausible way.
If the PID reports an implausible extreme value or behaves inconsistently with reality, that can direct you toward further investigation of the sensor circuit, wiring, data or control strategy.
But avoid diagnosing a thermostat or coolant sensor from one generic internet temperature range alone. Normal operating temperature and thermostat strategy vary by engine. Use manufacturer information when exact thresholds matter.
RPM, Calculated Load and Throttle Position
These PIDs help provide context for almost everything else.
RPM tells you engine speed. Use it to document whether a reading was taken at idle, at a steady elevated speed, during acceleration, or during deceleration.
Calculated load is an ECU-derived parameter, not simply a direct “how hard the gas pedal is pressed” sensor. It can help show the operating demand/context in which other values were captured.
Throttle position PIDs can show requested or actual throttle information depending on the vehicle/PID. Modern electronic throttle systems can expose more than one throttle or pedal-related value. Do not assume that every throttle PID should read exactly 0% at idle or exactly 100% at wide-open throttle without checking how that PID is defined.
How to Diagnose With Patterns Instead of Single Numbers
The biggest improvement you can make in live-data diagnosis is to stop asking one PID to solve the entire problem. Use relationships.
Example: positive fuel trim mainly at idle
Suppose a fully warmed engine in the appropriate closed-loop condition shows substantially more positive fuel correction at idle than it does when airflow increases. That pattern can justify investigating causes whose effect is proportionally greater at low airflow, including possible unmetered-air paths. But it is not proof of a vacuum leak. You still test.
Example: positive fuel trim across a wider load range
If positive correction remains significant across a broader range of operating conditions, the diagnostic direction may differ. Possible areas can include fuel delivery, airflow measurement, exhaust leaks affecting feedback, or other causes. Again, the pattern narrows the investigation. It does not name the failed part.
Example: suspicious temperature data
Imagine a vehicle that has been sitting overnight in moderate weather, but the coolant PID immediately reports a physically implausible extreme temperature. Before replacing the coolant sensor, compare intake-air temperature, ambient conditions, related DTCs, wiring/circuit information, and manufacturer service data. Live data has revealed a clue. Testing identifies the cause.
Example: an O2-related code without proof of a bad O2 sensor
An oxygen-sensor-related DTC does not automatically prove the O2 sensor itself has failed. Depending on the code and vehicle, diagnosis can involve sensor response, heater circuit, wiring/connectors, mixture condition, exhaust leaks, fuel control, and other sensor inputs.
This is the same rule SCG applies to all DTCs: the code and live data guide diagnosis. They do not replace it. For the deeper distinction between a code and a diagnosis, see Can an OBD2 Scanner Tell You Exactly What’s Wrong With Your Car?
Graphing Live Data
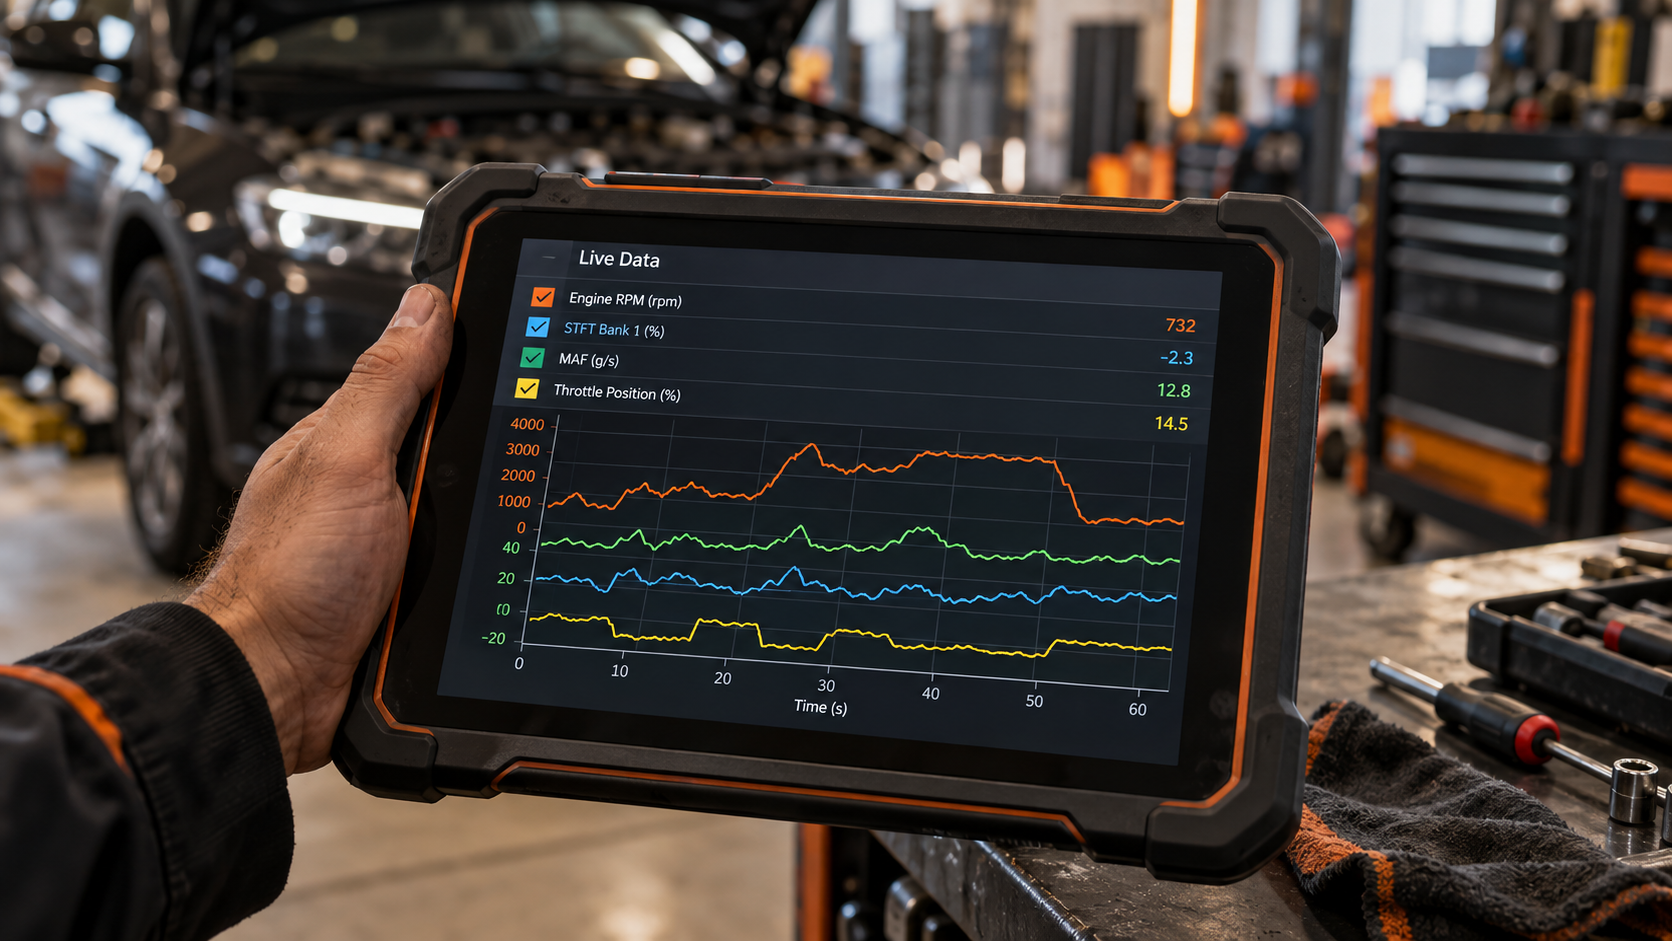
A graph can reveal behavior that is difficult to see as a list of rapidly changing numbers. Graphing is particularly useful when you need to see response speed, oscillation, spikes, dropouts, correlation between two parameters, or behavior during a change in RPM or load.
When possible, graph only the PIDs needed for the question. For example, rather than graphing 30 parameters at once, you might compare STFT Bank 1, LTFT Bank 1, RPM and MAF, or the relevant sensor set for the fault you are investigating. The exact group depends on the problem.
Also remember that a scanner’s displayed update rate is not necessarily the sensor’s raw internal sampling rate. Communication protocol, number of requested PIDs, scanner hardware and software can affect what you see.
Common Live-Data Mistakes
Mistake 1: Memorizing universal “normal ranges.” Generic ranges can be useful as orientation, but vehicle-specific design and operating conditions control the real interpretation.
Mistake 2: Diagnosing from one PID. Related PIDs often explain one another. Compare patterns.
Mistake 3: Ignoring engine temperature. Cold-start and fully warmed operation can produce very different values.
Mistake 4: Ignoring open loop vs closed loop. Fuel feedback data must be interpreted in the correct control state.
Mistake 5: Treating every O2 sensor as a narrowband sensor. Wideband/A/F sensors use different strategies and representations. Identify the sensor first.
Mistake 6: Treating a positive fuel trim as proof of a vacuum leak. It means the control strategy is adding fuel. The reason still has to be diagnosed.
Mistake 7: Treating a negative fuel trim as proof of a leaking injector. It means the control strategy is reducing fuel. Multiple causes are possible.
Mistake 8: Watching too many PIDs. A focused data set is easier to interpret and can provide a more useful refresh rate.
Mistake 9: Looking at numbers but not behavior. Response to a controlled change in operating condition can be more informative than one static value.
Mistake 10: Replacing a sensor because its data looks suspicious. Confirm with appropriate testing and vehicle-specific service information.
OBD2 Live Data FAQ
What does PID mean on an OBD2 scanner?
PID commonly means Parameter ID. It identifies a diagnostic parameter or status that the scan tool can request and display.
What is STFT?
STFT is Short-Term Fuel Trim. It represents relatively fast fuel correction by the engine-control strategy.
What is LTFT?
LTFT is Long-Term Fuel Trim. It represents learned fuel correction over a longer operating history.
What does positive fuel trim mean?
Positive fuel trim means the control system is adding fuel relative to its base calculation. It can point diagnosis toward a lean-correction condition, but it does not identify the cause by itself.
What does negative fuel trim mean?
Negative fuel trim means the control system is reducing fuel relative to its base calculation. It can point toward a rich-correction condition, but it does not prove which component caused it.
What should STFT and LTFT be?
There is no single diagnostic cutoff that should be applied blindly to every vehicle and operating condition. Small corrections around the calibration target are expected in normal feedback control, while persistent larger corrections can justify investigation. Use the pattern, operating state, both trims together and vehicle-specific information when exact limits matter.
Should I add STFT and LTFT together?
Adding them can be a useful rough way to understand the direction and approximate total correction at a particular moment, but do not turn that sum into a universal pass/fail specification. Manufacturer strategies and diagnostic thresholds differ.
Should an O2 sensor switch between 0.1 and 0.9 volts?
That familiar behavior applies to conventional narrowband zirconia O2 sensors under appropriate operating conditions. Do not apply it to every oxygen-related sensor. Wideband/air-fuel sensors operate and may be displayed differently.
What is Bank 1?
Bank 1 is the side of the engine containing cylinder number 1. On an inline engine there is generally only one cylinder bank. On V-type or other multi-bank engines, identify cylinder numbering from reliable vehicle information rather than guessing from driver/passenger side.
What is Sensor 1 vs Sensor 2?
In common OBD terminology, Sensor 1 is the upstream/pre-catalyst sensor for that bank and Sensor 2 is downstream/post-catalyst on typical two-sensor-per-bank arrangements. More complex exhaust systems can use additional sensors, so verify the exact vehicle layout.
Is live data better than trouble codes?
They answer different questions. A DTC tells you what diagnostic condition the system detected. Live data lets you observe supported parameters while the system operates. They are often most useful together.
Can live data tell me exactly which part is bad?
Not reliably by itself. Live data can reveal implausible values, relationships and patterns that narrow the diagnosis. Root-cause confirmation may still require inspection, electrical/mechanical testing and manufacturer service information.
Can every OBD2 scanner show live data?
Do not assume so. Capabilities and presentation vary by scanner, and the vehicle must support the requested data. Enhanced manufacturer-specific data may require a more capable scanner.
The Bottom Line
The purpose of OBD2 live data is not to find one magic number. It is to observe how the vehicle’s diagnostic information behaves under known conditions.
A better workflow is: define the symptom → read the codes and freeze frame → warm or operate the vehicle as appropriate → choose a small relevant PID set → establish the operating condition → compare related values → change the condition → watch the pattern → test the suspected cause → verify the repair.
Remember four rules: context before numbers; patterns before parts; related PIDs before isolated PIDs; vehicle-specific information before universal internet thresholds.
If you need to understand the code first, read OBD2 Codes Explained: How to Read Diagnostic Trouble Codes.
If you need the complete scanner workflow, read How to Use an OBD2 Scanner: Step-by-Step Guide.
If you are asking whether the scanner can identify the exact failed component, continue to Can an OBD2 Scanner Tell You Exactly What’s Wrong With Your Car?
If live data is your priority, compare the Best Bluetooth OBD2 Scanners or read our OBDLink MX+ review.